Solutions/Observability
Observability,
end to end across the estate.
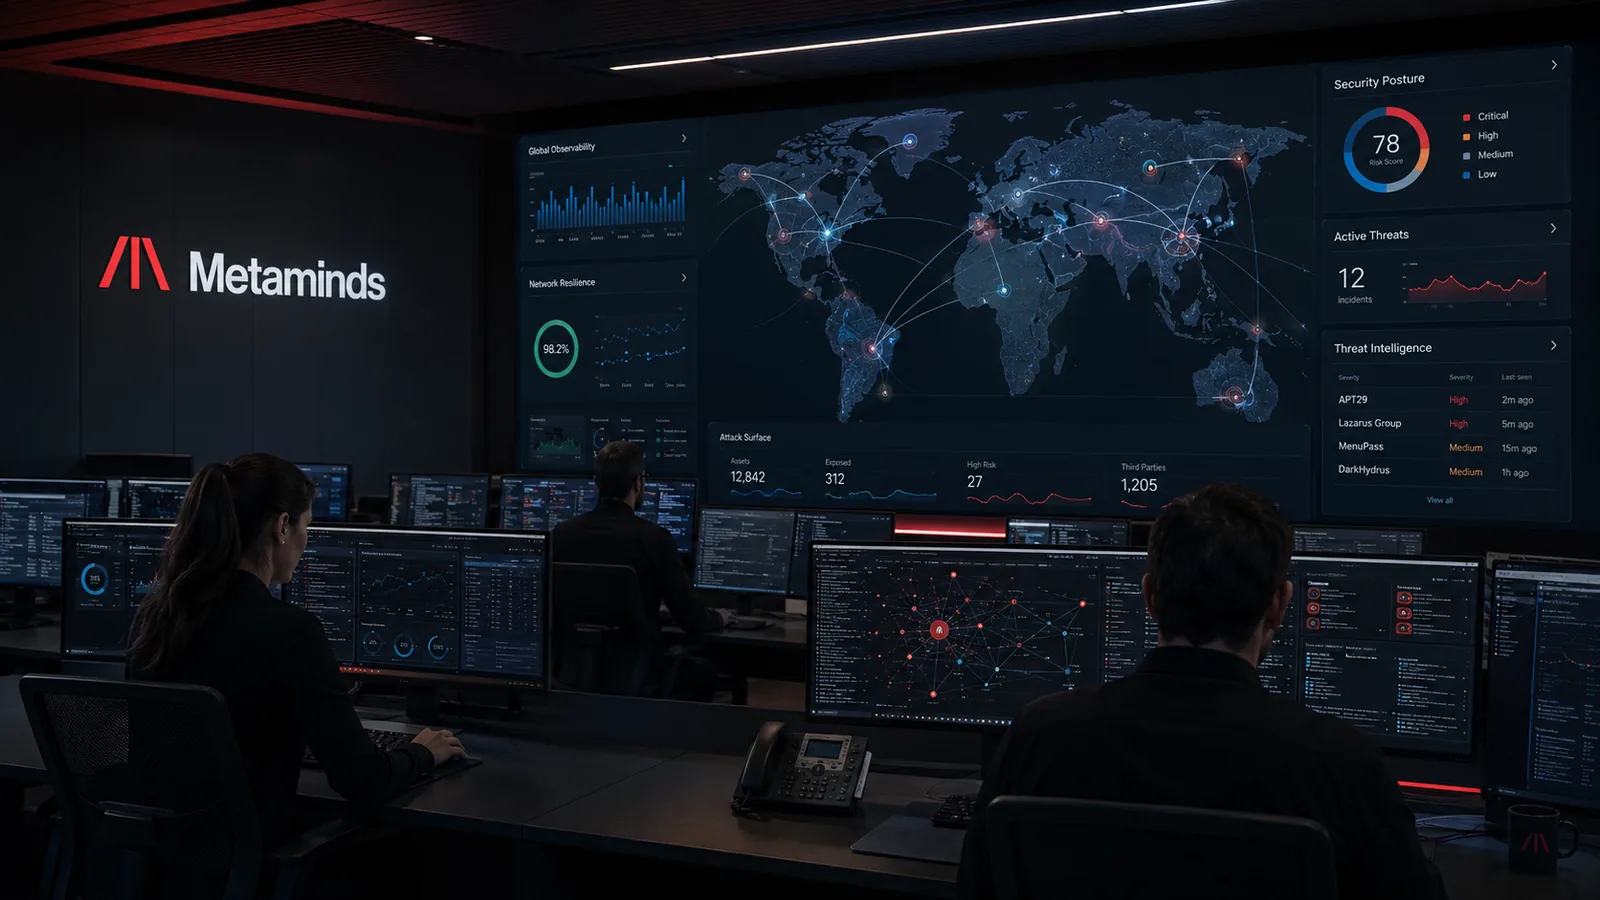
Telemetry, metrics and logging across the whole estate — so operations teams find the cause instead of guessing at it, with retention aligned to audit obligations.
Overview
Large estates fail in ways
no single dashboard shows.
An application error that is really storage latency, an outage that only appears in a firewall log. Institutions end up with monitoring per silo and no shared picture. We instrument the platform and everything on it as one system.
Services
Metrics & alerting
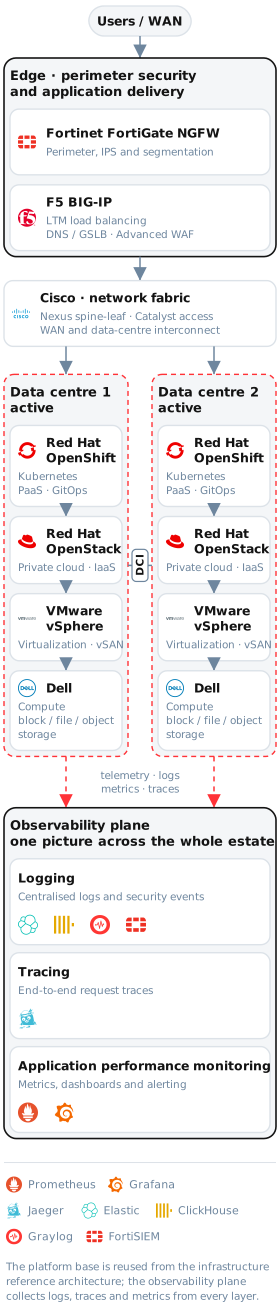
Prometheus and Grafana at estate scale, with routing that matches the support model.
Centralised logging
ELK and Graylog Security pipelines with retention aligned to audit obligations.
Tracing & performance
HyperDX distributed tracing with latency budgets per service.
Security telemetry
FortiSIEM correlation of infrastructure, network and application events into one timeline.
Operational readiness
Runbooks, SLO definition and handover training.
Technologies
we use
Full stack → We engineer the observability, not just the tooling: metrics, logs and traces from across the estate are correlated into one plane, so teams find the cause of a problem instead of guessing at it. Best-of-breed, open components — metrics and dashboards, distributed tracing, log search and analytics, and security telemetry — are integrated and operated as a single system, with retention aligned to audit and compliance obligations.
Case
studies
Government Cloud
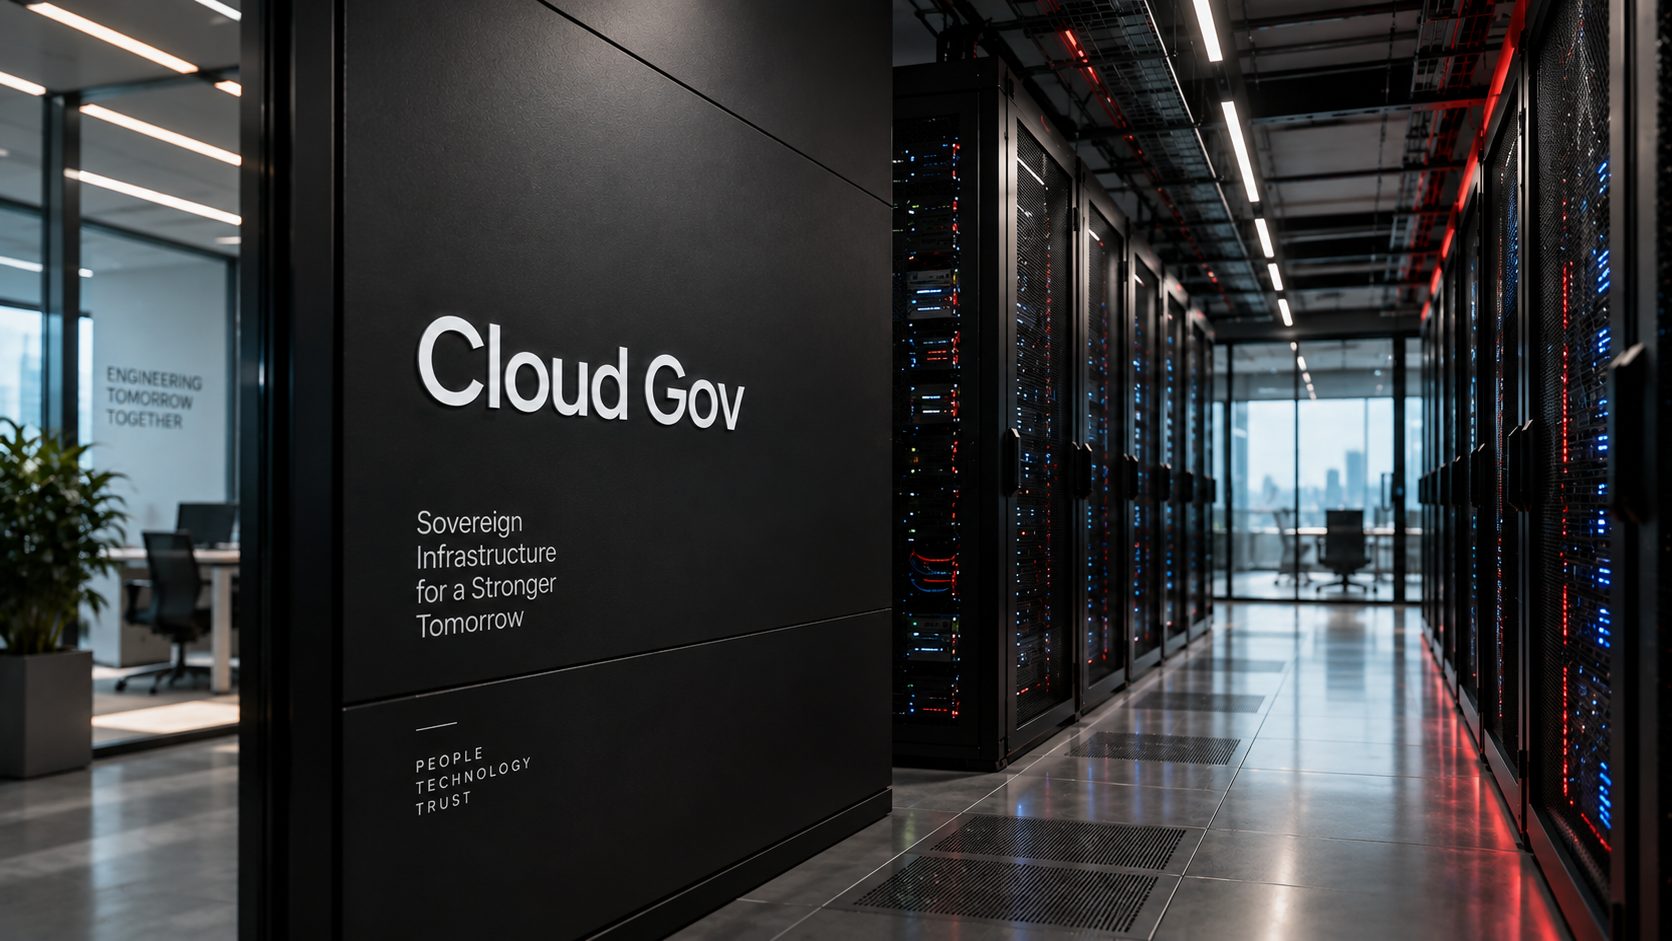
A sovereign private cloud for the Romanian public sector — over 500 servers across four Tier IV data centres, built end to end on Red Hat OpenShift and OpenStack.
Protecting applications at scale.
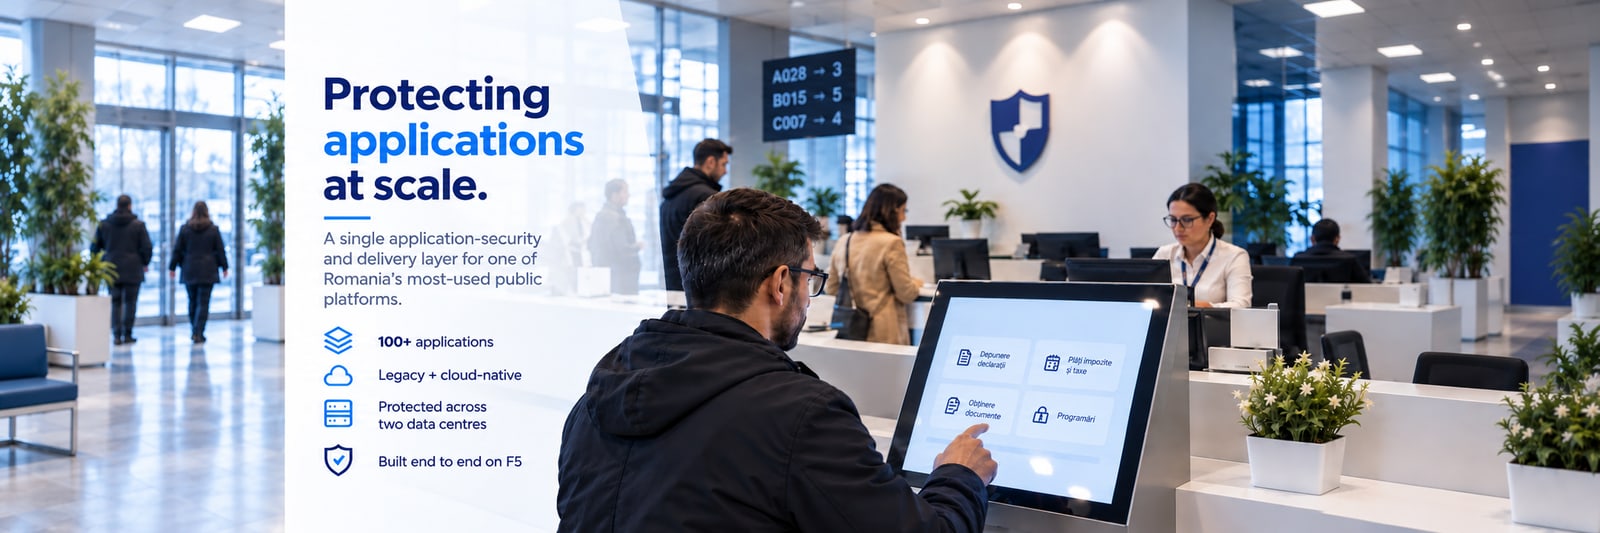
A single application-security and delivery layer for one of Romania’s most-used public platforms — 100+ legacy and cloud-native applications protected across two data centres, built end to end on F5.